Access by Proximity

ACCESS BY PROXIMITY

Condition for an Ecocity

The city provides residents with walkable access between safe and affordable housing, basic urban services, and open/green space. It demonstrates environmentally friendly transport options and provides walking and transit access to close-by employment.

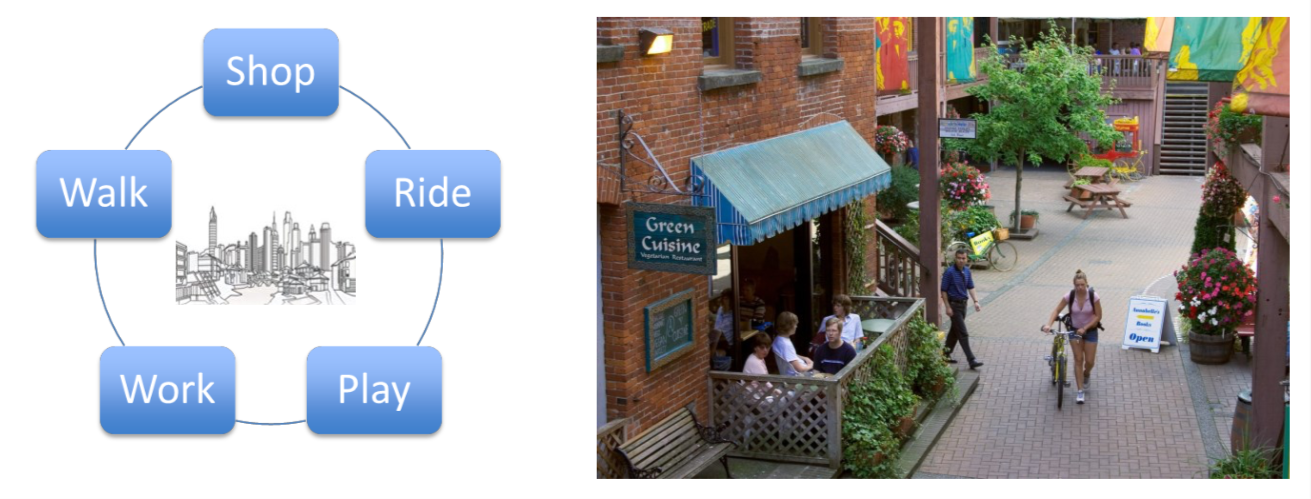
Justification: The ability for residents to access daily destinations (such as retail, services and employment) on foot, by bicycle, or by public transit reduces personal vehicle use, improves energy efficiency and land conservation, improves street vitality and safety, and creates opportunities for physical activity. The higher the percentage of trips taken by these sustainable modes, the fewer trips taken by car and thus the more sustainable transportation is within a city.

Suggested Headline Indicator

Median distance between housing, work and daily services.

Definition:
Excludes private motorized transit. Motorized transit (both public and for freight) must be powered from clean, renewables sources. A large city or region may have multiple centres, each one is self-sufficient for the most part, and some may wish to be designated as an “ecocity fractal.”

Description:
A distinguishing feature of ecocities is that they enable “access by proximity” (Register 1987). This is important for quality of life and reducing automobile reliance (Newman and Kenworthy 1999).

Ecocities concentrate density coupled with a mix of uses to enable access by foot to jobs, services, natural areas, and entertainment. To reduce reliance on automobiles, the nodes of development within ecocities are connected through rapid transit. Getting where you need to go becomes fast and effective when the transit service is frequent and drop-off points are centrally located just a few minutes walk from your destination.

A challenge to transforming urban centres to pedestrian/transit-oriented development is minimum parking requirements that stipulate a number of parking stalls be made available per square foot of built area. This approach of designing for the car as the primary mode of transportation can prevent clustered development, the type needed for access by proximity. An example is the sea of parking that surrounds many shopping malls, even ones that are serviced by rapid transit. In Vancouver, for example, transportation accounts for the second largest component of the city’s ecological footprint (COV 2011), and single occupant vehicle travel is responsible for half of that (Moore 2013). Of course, goods movement is also a challenge, but one that can be overcome with a shift in investment to home delivery service.

The city provides residents with walkable access between safe and affordable housing, basic urban services, and open/green space. It demonstrates environmentally friendly transport options and provides walking and transit access to close-by employment.

Finally, there are people for whom walking is not an option due to physical ailments or disabilities. Making sure that people with special needs can be accommodated is a priority that can be met through greater investments in transportation services. Medical assisted travel is expensive but these costs can be offset by the savings in reduced motor-vehicle infrastructure. To achieve access by proximity, therefore, requires not just smart land-use decisions but a shift in public service investment coupled with a transportation system designed around moving people first, then goods, and lastly single-occupant vehicles.

An ecocity mapping system available through Ecocity Builders (www.ecocitybuilders.org/mapping-urban-villages) can help guide development towards zoned centres of social, cultural and economic vitality. Shifting development towards existing centres clarifies the best location for new open spaces to accommodate the restoration of natural features such as waterways. It also helps identify opportunities for expansion of urban plazas, parks, gardens, playgrounds and other open spaces.


References:
Moore, Jennie. 2013. Getting Serious About Sustainability: Exploring the Potential for One-Planet Living in Vancouver. Vancouver BC: University of British Columbia (https:// circle.ubc.ca/handle/2429/44943).
Register, Richard. 1987. Ecocity Berkeley: Building Cities for a Healthy Future. Berkeley CA: North Atlantic Books.
COV (City of Vancouver). 2011. Greenest City Action Plan. Administrative Report, July 5. Vancouver BC: City of Vancouver (http://vancouver.ca/greenestcity/).
Newman, P. and J. Kenworthy. 1999. Sustainability and Cities: Overcoming Automobile Dependence. Washington DC: Island Press.

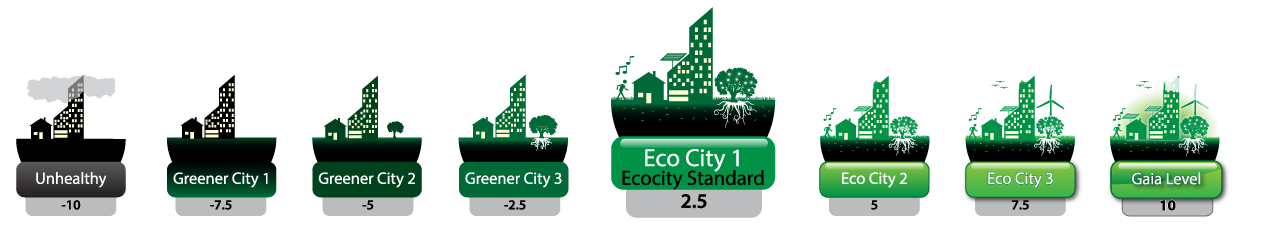
Suggested Ecocity Level 1 Benchmark

80% of population lives within 300 metres of basic services

Rationale:
A high “eco-mobility” mode split that favours walking, cycling and transit over the use of private automobiles is likely to reflect the goal of putting everyday needs close to one another. Although the Walk Score methodology more closely approximates the goal of access by proximity, it has at least two drawbacks: 1) Walk Score measures proximity by straight line measurement, ignoring the possibility of actual barriers to access (such as highways) or the pedestrian-friendliness of the route. Consequently, mode split may be a more accurate estimate of the extent to which walkers, bicyclists and public transportation users experience proximity. 2) Walk Score is primarily available in the US, Canada and Australia. Even though data to estimate mode split is not universally available, it is more ubiquitous than Walk Score. The proposed eco-mobility mode split of 86 percent is based on survey research undertaken by Newman and Kenworthy (1999), Kenworthy 2006), Moore (2013) of cities that achieve among the lowest per capita vehicle kilometers travelled per capita. See Moore (2013) page 174, regarding eco-mobility mode split of 86% for downtown Vancouver BC, which compares favorably with mode splits in high density cities like Tokyo (88%) and Hong Kong (89%). Moore estimates transportation CO2 emissions of 1.6 tCO2e per capita if all of Vancouver achieved 86% eco-mobility mode split.
Ecocity 1: 86% is used because it is benchmarked against Hong Kong, Downtown Vancouver. Hong Kong is 89% walk, bike, transit.