Environmentally friendly transport

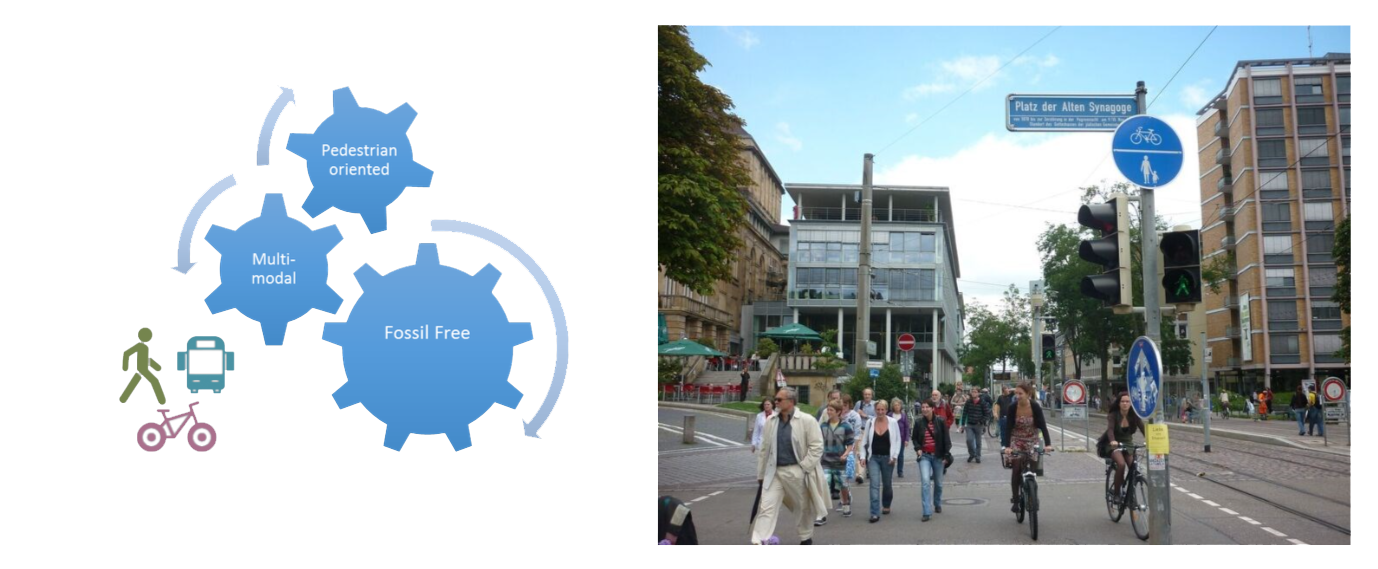
ENVIRONMENTALLY FRIENDLY TRANSPORT

Condition for an Ecocity

Non-motorized transportation is supported and encouraged by the city and is used by a significant proportion of people for trips under 5 km. Mode split aims towards the access-by-proximity principle with 80% of trips made by walking, bicycling or low emissions public transportation.

Suggested Headline Indicator

Percentage mode split for walking, cycling, and transit.

Description:
Environmentally friendly transport designed for the human body instead of the car body is an important aspect of ecocity development that supports the Ecocity Standards of Access by Proximity and Clean Air. It can also yield substantial socio-economic benefits. Cities such as Bogota, Curitiba, and Copenhagen have advanced a healthy and equitable economy by placing emphasis on affordable transportation systems that promote accessibility to everyone not just those who own a car (Curtis 2003; Goodman et al. 2005; Nelson 2007). These cities implemented integrated land use and transportation demand management strategies including: a) increases in density of both jobs and housing close to transit services, b) expansion of pedestrian, bicycle and transportation infrastructure and services, c) restrictions on motor vehicle use. Including a cap or even a reduction in roadway and parking available to cars, road tolls and parking fee increases.
For example, systematic investment in bicycle infrastructure in Copenhagen has resulted in a significant increase in the mode split for cyclists, now at 41% of all commuter trips in the greater Copenhagen metropolitan area (Cathcart-Keays 2016).

Cities with very high walking, cycling and transit mode share (i.e., 75% or more) typically have high density, mixed use urban centres at or above 100-200 people per hectare and are supported by a transportation strategy that prioritizes pedestrians first, then cyclists followed by transit users (Newman and Kenworthy 1999). Cities that achieve this level of mode split approach what would be needed to stay within ecological boundaries of greenhouse gas emissions associated with a one-planet lifestyle (Moore 2013, 2015). Goods movement is also an important consideration that must be addressed through attempts to support use of clean and renewable energy and an integrated transportation system that works with the design of a city to minimize the distances goods are transported.


References:
Cathcart-Keays, Athlyn. 2016. “Two-wheel takeover: bikes outnumber cars for the first time in Copenhagen,” The Guardian, November 30, 2016. Available online: https:// www.theguardian.com/cities/2016/nov/30/cycling-revolution-bikes-outnumber-cars-first- time-copenhagen-denmark (Accessed on June 16, 2017).
Curtis, Ryan. 2003. Bogota Designs Transportation for People, Not Cars, World Resources Institute Features, Vol. 1, No. 1. http:archive.wri.org/newsroom/ wrifeatures_text.cfm?ContentID=880
Goodman, Joseph, Melissa Laube, Judith Schwenk. 2005. Curitiba’s Bus System is Model for Rapid Transit, Race, Poverty and the Environment, Winter 2005-2006: 75-76. http://urbanhabitat.org/node/344
Moore, Jennie. 2015. Ecological Footprints and Lifestyle Archetypes: Exploring Dimensions of Consumption and the Transformation Needed to Achieve Urban Sustainability. Sustainability, 7: 4747-4763. doi:10.3390/su7044747.
Nelson, Alyse. 2007. Livable Copenhagen: The Design of a Bicycle City. Seattle: University of Washington. http://greenfutures.washington.edu/pdf/ Livable_Copenhagen_reduced.pdf
Newman, Peter and Jeffery Kenworthy. 1999. Sustainability and Cities: Overcoming Automobile Dependence. Washington DC: Island Press.

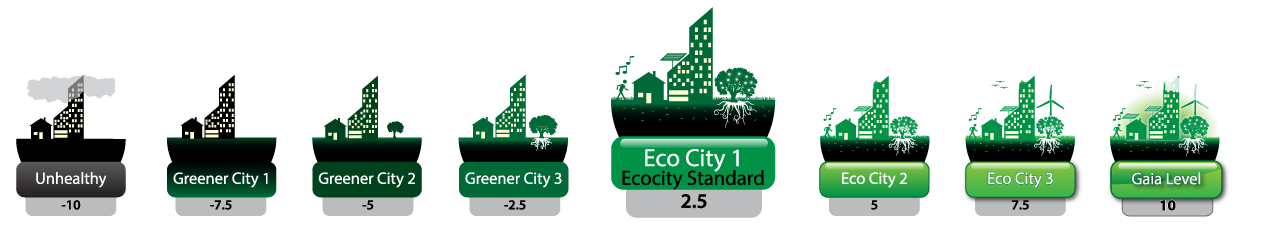
Suggested Ecocity Level 1 Benchmark

86% of trips taken by walking, cycling, transit and freight deliveries.

Rationale:
The proposed eco-mobility mode split of 86 percent is based on survey research undertaken by Newman and Kenworthy (1999), Kenworthy 2006), Moore (2013) of cities that achieve among the lowest per capita vehicle kilometers travelled per capita. See Moore (2013) page 174, regarding eco-mobility mode split of 86% for downtown Vancouver BC, which compares favorably with mode splits in high density cities like Tokyo (88%) and Hong Kong (89%). Moore estimates transportation CO2 emissions of 1.6 tCO2e per capita if all of Vancouver achieved 86% eco-mobility mode split.

Ecocity 1: 86% is used because it is benchmarked against Hong Kong, Downtown Vancouver. Hong Kong is 89% walk, bike, transit.