by Sven Eberlein
The following is an excerpt from a series of workshops and meetings discussing the IEFS with a range of stakeholders and expert advisers in Vancouver, Canada, from February 9-14.
The original series was published on Daily Kos and can be found in its full length at the following links:
Carless in Vancouver, Part 1: Boots on the Ground
Carless in Vancouver, Part 2: Going for the high-hanging fruit
Carless in Vancouver, Part 3: Follow the Flow
Saturday, February 12th
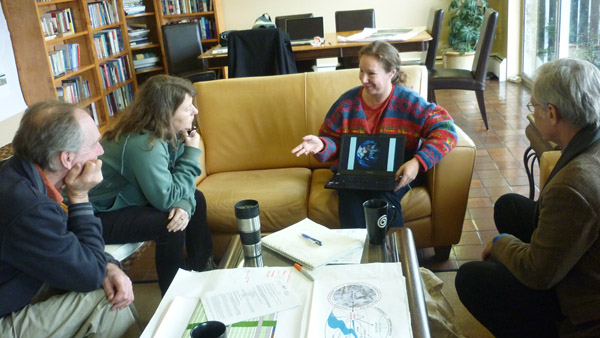
The IEFS Core Advisory Committee meeting took place at Core Adviser Jennie Moore and her partner Jonn’s place in West Vancouver. While not everyone on the committee had been able to make it to Vancouver, we had a nice core group of Jennie, Jonn, Kirstin Miller, Richard Register, and special guest Sebastian Moffatt, visionary building scientist, environmental planner, and co-author of Eco2 cities: ecological cities as economic cities, who was joining us for the day to share some of his methods of measuring material flow in an organism as complex as a city.
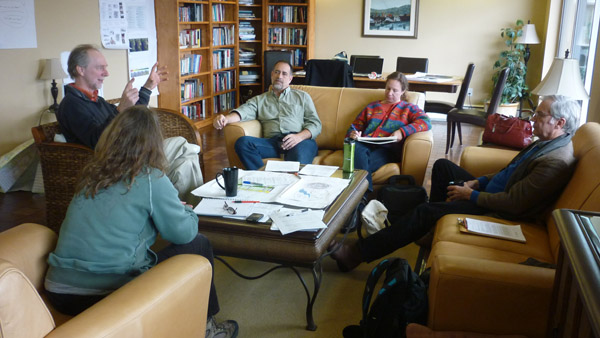
The objective of the meeting was to fine-tune some of the language on the 15 IEFS indicators by which cities can assess their progress in becoming ecocities.
Here’s a way to visualize an ecocity assessment along these 15 conditions, color-coded for natural, social, and financial capital.
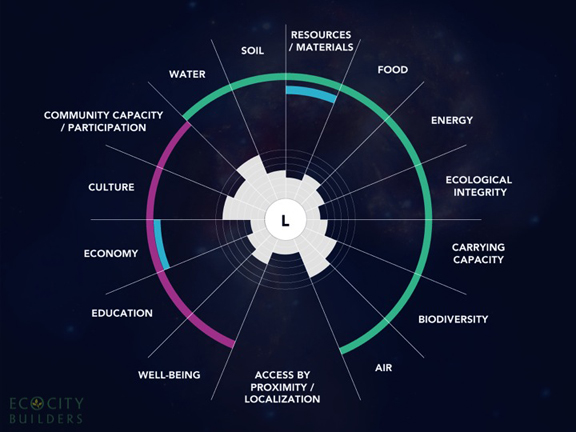
Our task was to refine some of the specific indicators by which these conditions can be assessed. When it comes to figuring out the Resources/Materials dimensions of a city, Sebastian has very clear ideas of how it can best be done. His material flow analysis method looks at a city’s infrastructure like a living organism, with the natural and cultural environments feeding into and out of the built environment.
It’s really all about connecting circles and understanding the whole picture…
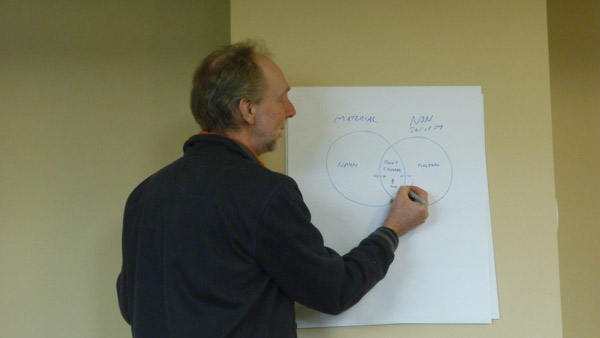
Sebastian gave us a rundown for his preferred method of analyzing flows and forms, meta diagrams. Meta diagrams are basically visualization tools that illustrate complex information in simple and standard ways, as well as tools to calculate the flows of energy, water and materials through cities. Simply put, it’s a way to track all that goes into a city, all that comes out on the other end, and what happens in between, which is what you need in order to assess a city’s overall energy efficiency and ecological footprint. In fact, in most cities there currently is nobody who can describe the entire energy system and understands the whole input/output picture.
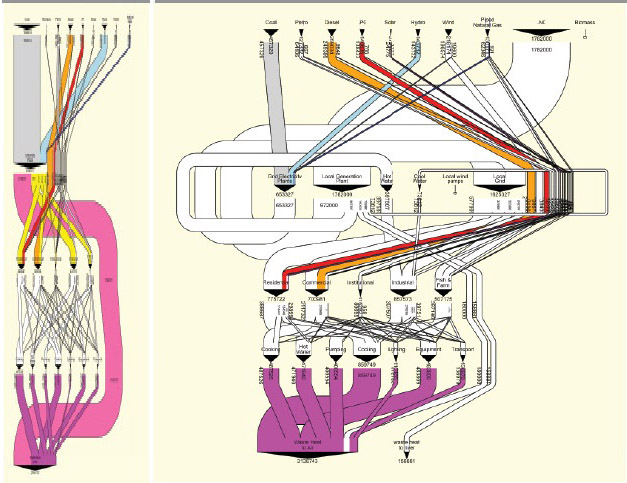
The actual visualization happens through a type of a Sankey diagram that Sebastian says is worth a thousand pie charts. If you think of it like an onion, with materials going in at the top and coming out at the bottom, then the fatter the middle the more efficiently a city is using its resources and the closer to ecocity level it is getting.
Here’s an example from Eco2 cities that shows a meta diagram of the current energy system of Jinze, Shanghai on the left, and a scenario for an advanced system on the right.
The meta diagram on the right provides a scenario for an advanced system that helps reduce emissions and costs and increase local jobs and energy security. For example, a local electricity generation facility is powered by liquified natural gas and provides a majority of the electricity needs and hot and cool water for industry (cascading).Source: Author elaboration (Sebastian Moffatt) with approximate data provided by Professor Jinsheng Li, Tongii University, Shanghai.
Pretty heady stuff, though actually quite entertaining to listen to someone with as much heart and soul as Sebastian. There were several times when Richard and Sebastian were immersed in an animated tango of ideas that reminded me just how blessed I was to be a fly on the wall with these two pioneers. I really love this shot I took of them as we were heading to lunch.
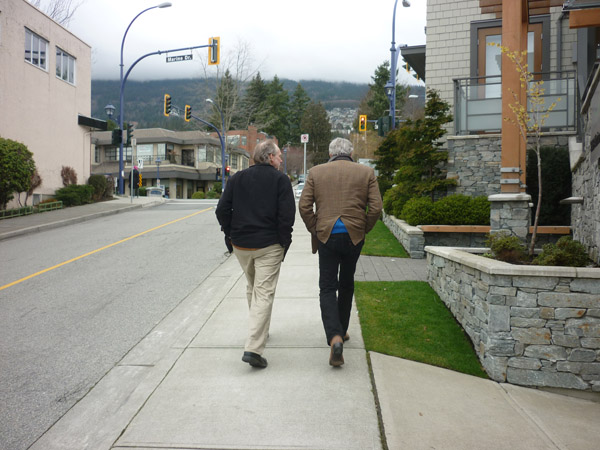
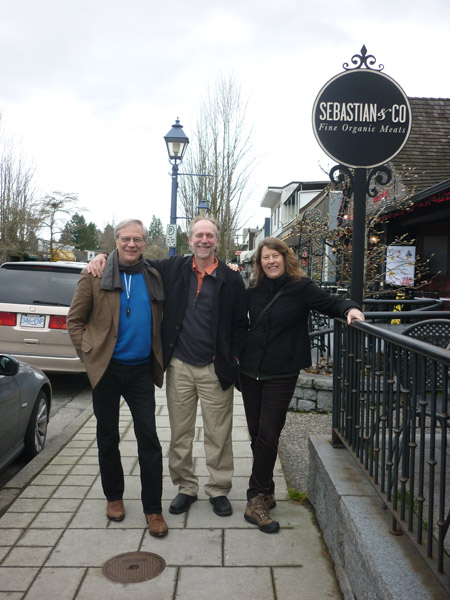
Sebastian & Co…
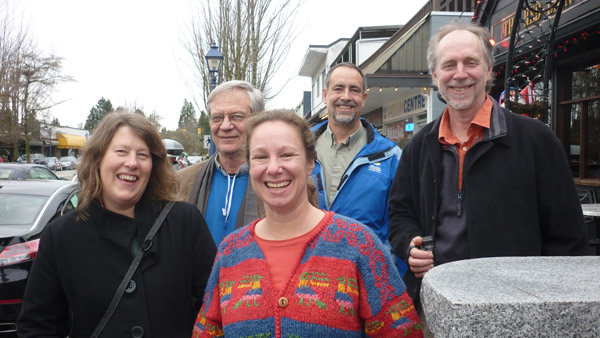
The whole crew having a great old time…
After lunch we went through a few more of the IEFS Indicators, refining, tweaking, and streamlining language and definitions, also with an eye toward the Road to Rio.
When I finally got on the bus back to Vancouver Island, the sun had already set and I was ready to get back to my abode to get some well-deserved rest, but travel has a way of thwarting your plans in mysterious way. I’m not sure why I decided to walk across downtown to the Yaletown station instead of connecting directly to the Canada Line at City Centre, but sometimes you just have to follow your intuition into the light.

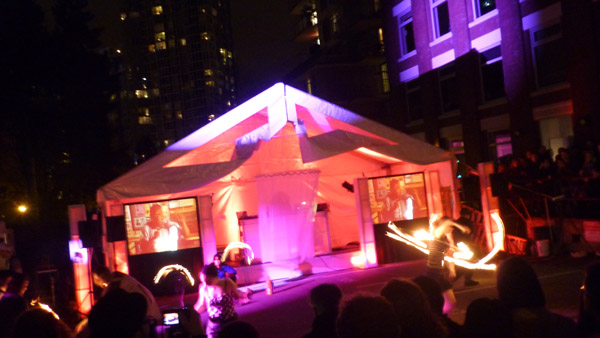
I had accidentally discovered Illuminate Yaletown, a street party featuring amazing light installations from local artists.
From flickering ice sculptures…


to fiery dance parties…
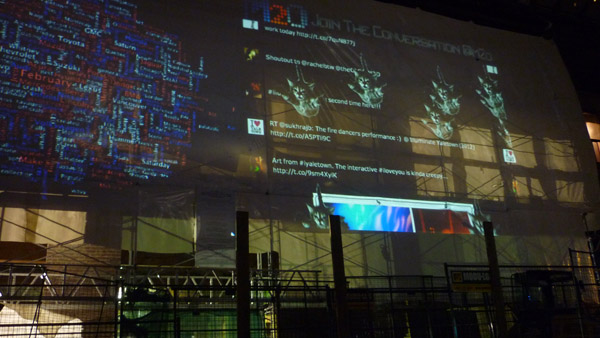
from futuristic digital projections…
to good old fashioned pedaling for the light…
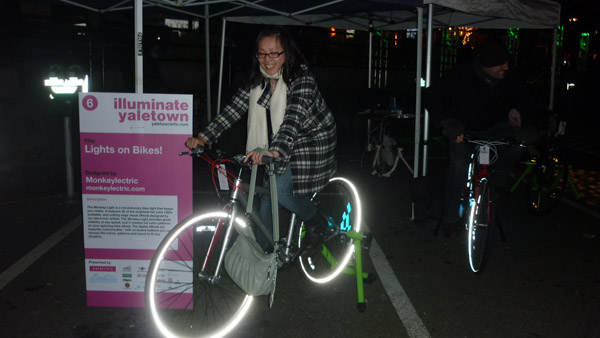
it was a perfect in-the-body ending to an in-the-head day. It brought me back to my basic understanding of what it is about cities that makes them such fertile grounds for the kinds of ideas and interactions that will help humanity transition into a world with fewer fossil fuels: their capacity to bring us closer to each other, to make us marvel at the small things in life, and just perhaps, to get a little closer to each other.